

The Nine Indias
India is better understood as nine separate economies, and the gaps between them are widening fast enough to make national averages useless.

India’s headline per-capita income hovered just above $2,400 in fiscal year 2025, but the number hides more than it reveals. Take out the top two income cohorts — some 82 million of the country’s wealthiest citizens — and the average for the remaining 94% drops below $1,150. Remove the aspirational urban emerging group as well and the bottom 90% are left at roughly $900 a year per person.
The aggregate statistics in pitch decks and policy keynotes describe the reality of a thin upper crust rather than the typical household. India is not a single unified marketplace, or even two marketplaces, but a stack of as many as nine distinct consumer economies separated by gaps wide enough to make national averages practically useless. Getting this right matters for anyone trying to understand where Indian consumption is actually headed.
A recent CLSA report, ostensibly about stock picking, includes a methodology that maps this fragmented population in unusual detail. It stitches together income-tax filings, rural wage data and employment records from the EPFO and NABARD’s All India Rural Financial Inclusion Survey, then cross-references these against census and MoSPI figures, MGNREGA rolls and asset-ownership indicators such as cars, two-wheelers, ACs, washing machines and smartphones.
It then swaps rupees for time, arguing that the true measure of affordability is the number of hours one must work to buy anything from a bar of soap to a holiday. India, hence, becomes a collection of distinct groups whose economic realities bear almost no relation to one another, where a quick-service meal or a streaming subscription costs minutes of work for some households and hours of toil for others.
At the urban apex sit the “wealthy” — large business owners, senior professionals, senior government officials and top executives with gross household incomes above ₹10 million (~$113,000) — flanked by the urban affluent on ₹1.2–10 million, a group that includes midsize business owners, professionals, corporate executives, senior government employees (Group A), senior IT services staff and college professors.
The ladder descends through the urban emerging cohort of mid-level professionals, regular salary earners, small business owners and Group B government employees on ₹0.5–1.2 million, down to the urban mass of regular wage earners, Groups C and D government staff, entry-level IT workers and microbusiness owners on ₹0.2–0.5 million ($2,250-$5,650), and then to the urban blue-collar cohort of daily wage labourers, part-time factory workers, gig workers, migrants and other non-skilled workers on under ₹0.4 million.
On CLSA’s FY25 numbers, that translates into average annual household incomes of about $3.4 million for the tiny urban wealthy cluster, roughly $50,000 for the urban affluent, $13,600 for the urban emerging, $5,400 for the urban mass and $4,400 for the urban blue-collar group.
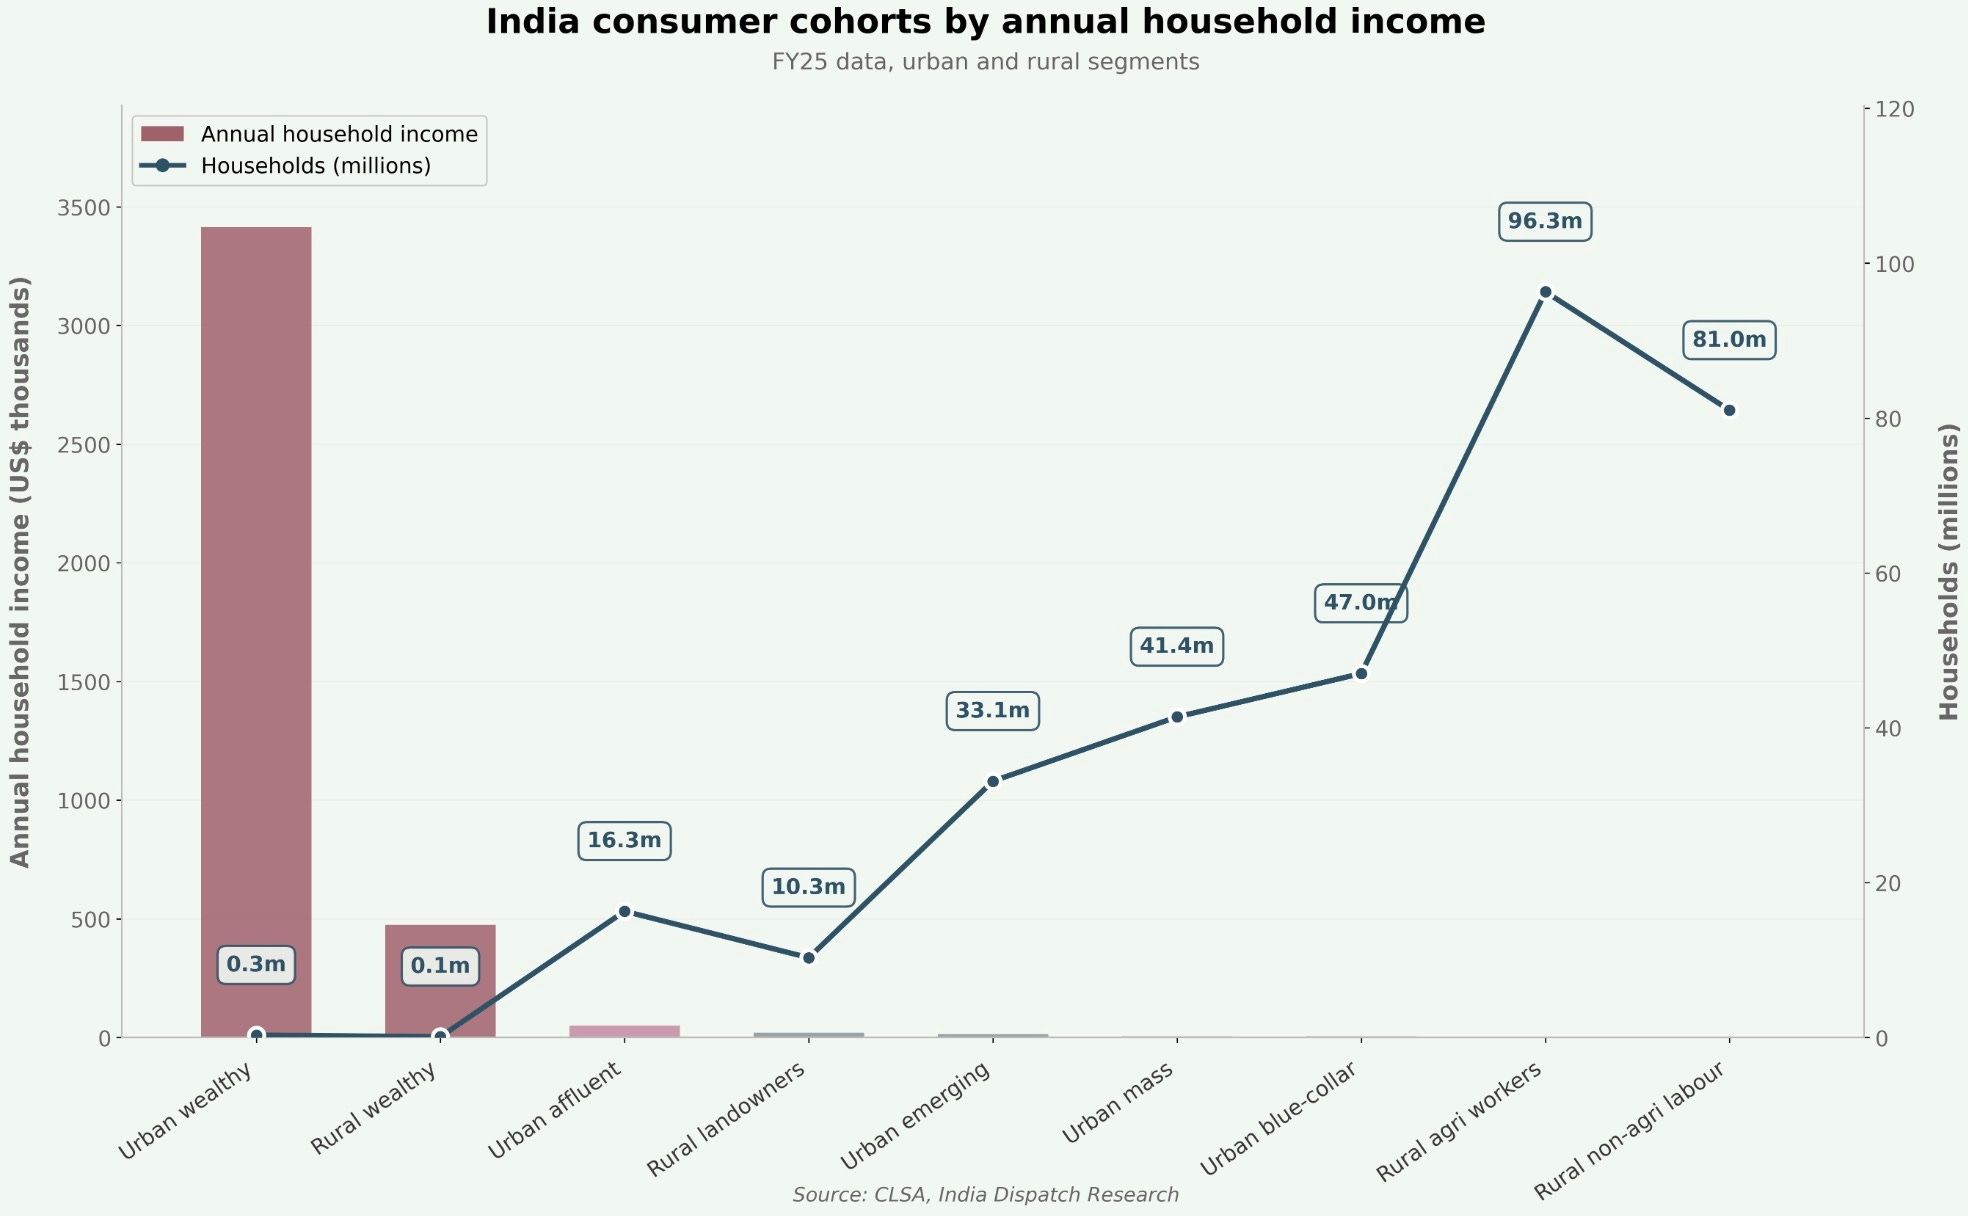
India’s 325.8 million households earned an average of about $10,600 in fiscal 2025, but that blended figure masks a sharp urban-rural split: the 138.1 million urban households already earn around $20,100 on average, while rural households manage on roughly $3,600. CLSA projects that by fiscal 2035 the number of households will rise to 381.6 million and average income to about $18,400, with urban households reaching roughly $30,500 and rural ones about $5,700, so the absolute gap in living standards remains wide even as incomes rise at both ends.
Today, the three highest-earning urban cohorts — wealthy, affluent and emerging — make up only about 15% of Indian households but already command roughly 68% of the total income pool; by fiscal 2035 CLSA expects them to represent close to a quarter of households and about 77% of national income. For rural agricultural and non-agricultural workers, incomes also rise but from a much lower base and without a comparable shift in economic status.
States such as Maharashtra, Karnataka, Tamil Nadu, Delhi and Gujarat have far higher levels of organised employment and asset ownership, so the more prosperous urban cohorts cluster disproportionately in a handful of city-regions rather than spreading evenly across the country.
The behaviour and expansion of these cohorts have a direct implication for India’s consumption story. For consumer brands, the practical addressable market over the next decade is less “1 billion Indians” than a set of dense urban corridors whose income pools, in CLSA’s mapping, already resemble entire economies such as Brazil, South Korea, Switzerland or Sweden rather than the national average.
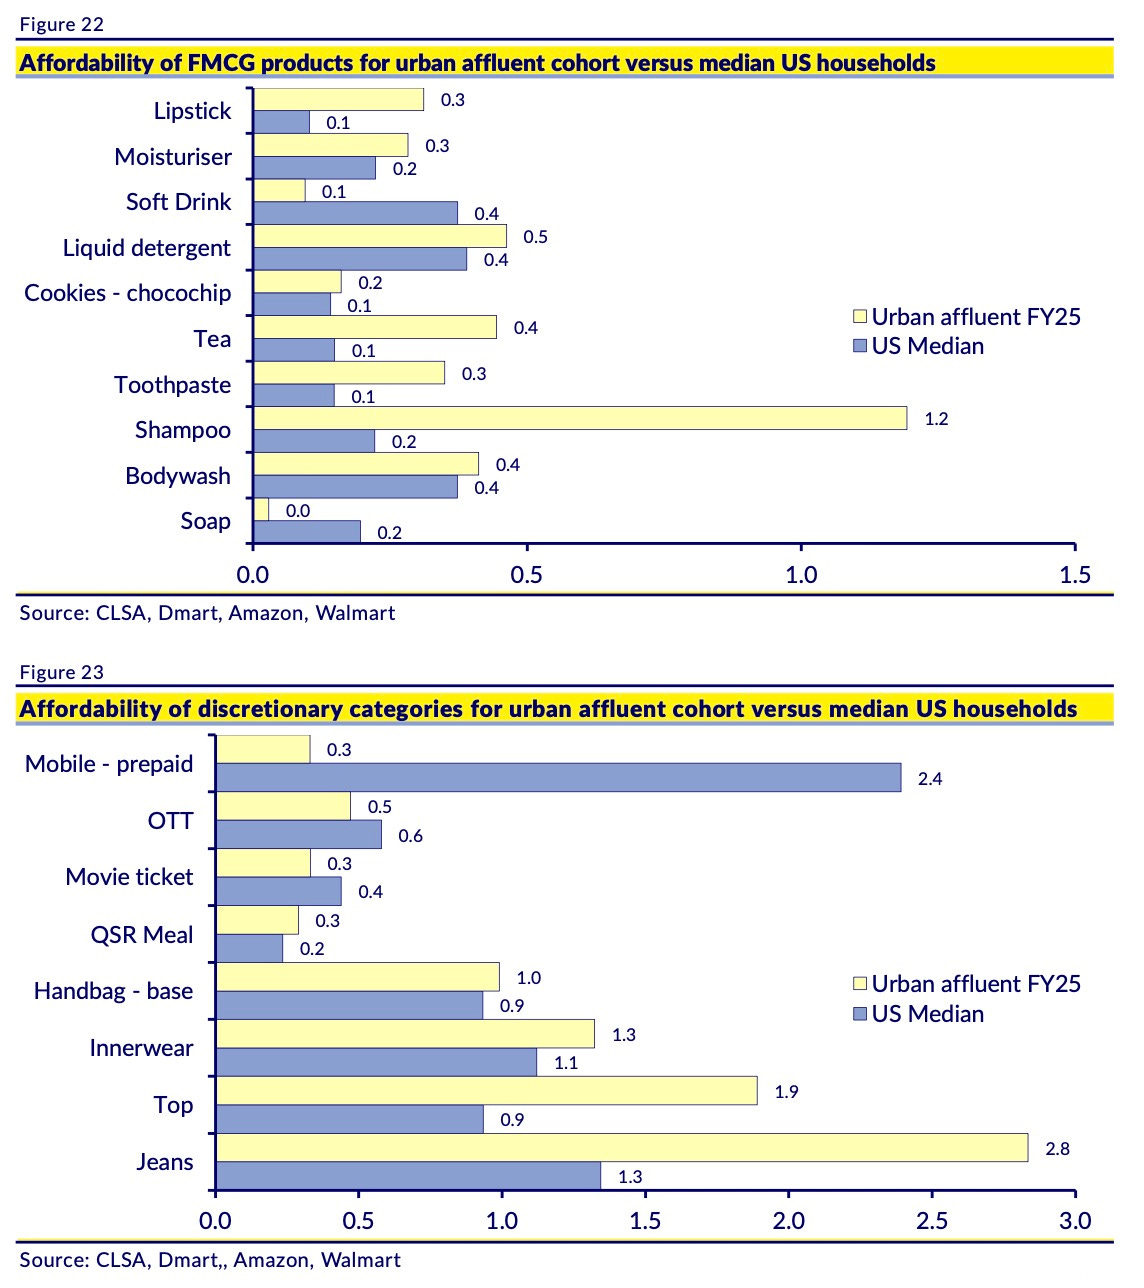
When you measure prices in hours worked, CLSA’s affordability analysis shows each cohort inhabits a different universe. For urban affluent households, staples such as soap, shampoo, tea and biscuits consume only small fractions of a working day, comparable to households at similar income levels in developed markets, while apparel, electronics and cars still demand far more time because of local pricing structures and duties. For the urban emerging and mass cohorts, the hours-worked burden across categories looks closer to that of middle-income Asian economies, and for the rural worker cohorts spending remains heavily skewed toward basic food and essentials. The barrier to shifting from a one-time trial of a product to a weekly habit is not just the sticker price but the amount of working life that has to be traded to acquire it.
India has the world’s largest Gen Z population — digitally native cohorts whose consumption habits differ sharply from those of their parents — but the demographic promise is running into a labour market too narrow to absorb them. Excluding the pandemic year of fiscal 2021, EPFO records suggest only about 3.6 million new formal jobs have been created annually over the past five years, a trickle compared with the flow of graduates entering the workforce. Indian colleges produced an average of 6.8 million undergraduates a year between fiscal 2018 and 2022, including 3.6 million women, plus around 1.6 million postgraduates, while another 16–17 million students finished secondary school and 12–13 million completed high school. This creates a clear gap in the funnel between organised employment and qualified manpower, with a rising share of young workers pushed toward lower-paying informal or gig roles.
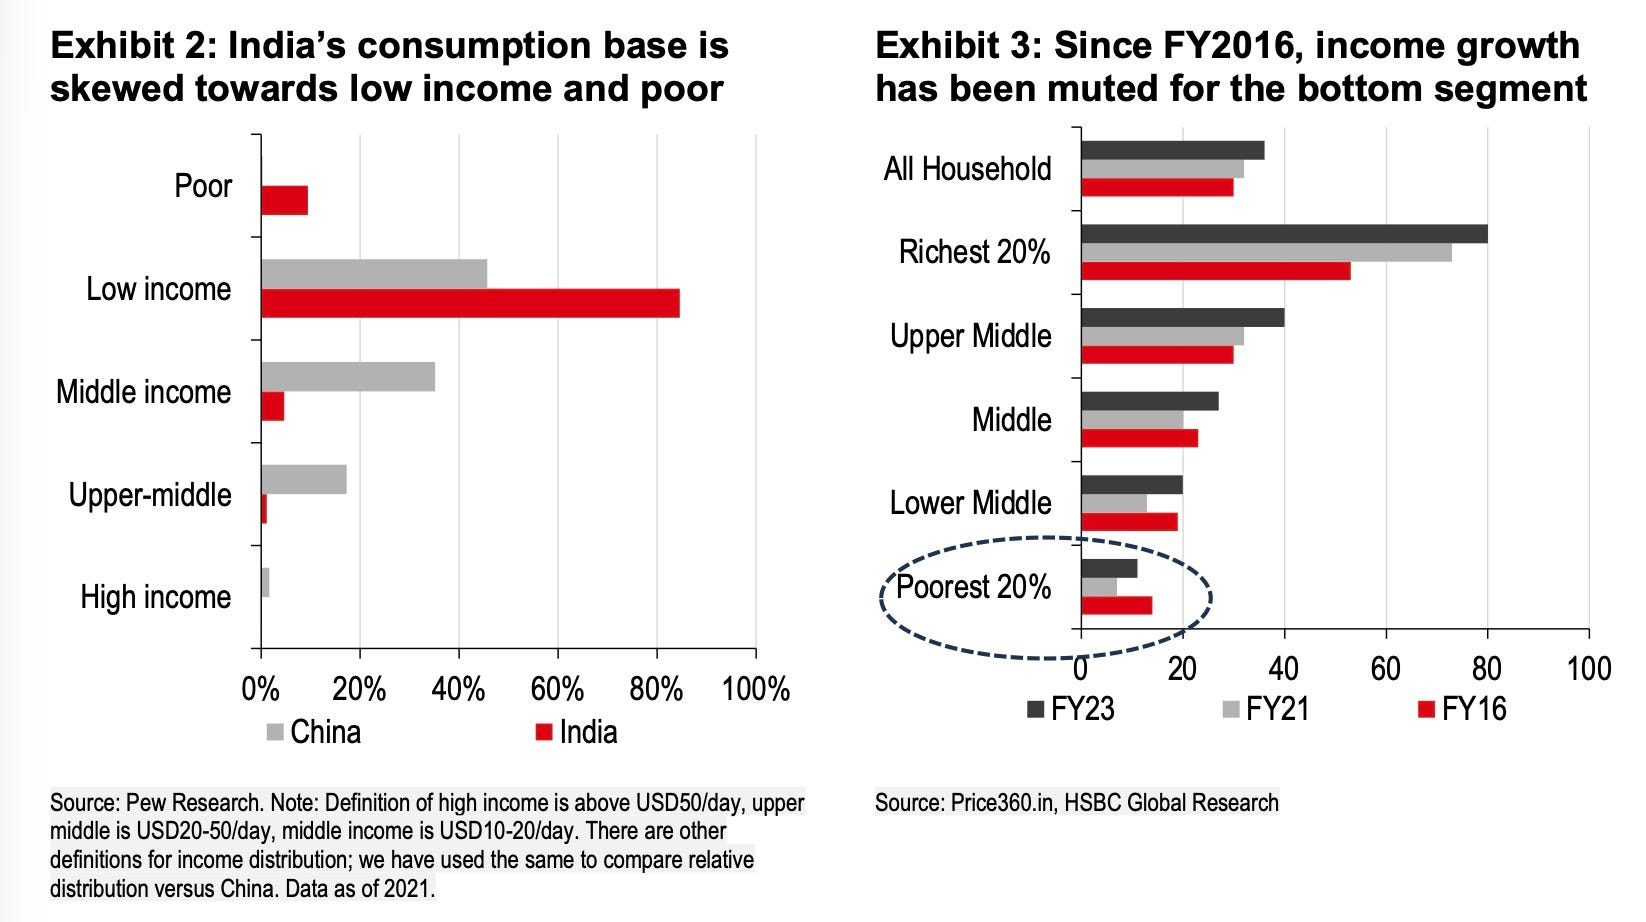
Separate analysis by HSBC shows that real rural wages have been broadly flat since the mid-2010s and that income growth for the bottom bands has lagged the higher cohorts, which is exactly what you would expect in an economy creating too few good jobs relative to its supply of educated workers.
The bottleneck places a hard ceiling on wage growth for the lower tiers, where annual income growth for the urban mass and urban blue-collar cohorts is projected at a tepid 3.5-4.0% between fiscal 2025 and 2030 before tapering to about 3% through 2035. Rural workers may see slightly faster growth of 5.0-5.5% annually for agricultural and non-agricultural labour households, but the size of these cohorts is expected to stay flat as urbanisation drains the countryside. Any corporate strategy betting on high-teens volume growth from low-income segments is, implicitly, a wager on the job machine suddenly accelerating — a bet the current employment data does not support.
That tension is already visible in the sales lines. HSBC notes that blended FMCG volume growth has been unusually muted since fiscal 2021, and that rural demand in particular has been patchy despite repeated price cuts and promotions, because household budgets never received the wage lift implied by headline GDP.
To keep the wheel turning, policy has started leaning more directly on household balance sheets. Bank of America estimates that recent changes in personal income tax, GST and deposit rates together free up on the order of ₹2.5–3.0 trillion (~$30 billion) of spending power over a couple of years, while HSBC reckons that the combined effect of income-tax tweaks, GST cuts and repo-rate reductions amounts to roughly 2-3% of private consumption and up to 8% of the addressable market for listed discretionary and staples companies. In practice, that fiscal and monetary push flows mainly through the same relatively narrow band of solvent, urban taxpayers.
Households that do manage to climb into the middle and upper brackets follow a predictable pattern, where food and non-alcoholic beverages, which currently devour about 30% of the average Indian household budget, get steadily displaced by transport, insurance, beauty, personal care, healthcare, housing, hotels, catering and leisure. Historical data from China and the US confirms this, and the analysis treats these shifts as the “genetic” architecture of future profit pools, assuming that where richer peers spend most as they move up the income ladder is where India is likely to follow.
Compare India’s current per-capita consumption to China, Vietnam and the Philippines and the categories with room to grow become obvious. Alcoholic beverages, energy drinks, baby food, flavoured milk drinks, liquid detergents, colour cosmetics and pet food are all so far below regional peers that catching up would require double-digit compound annual growth for a decade or more, while staple categories like edible oils, tea, sweet biscuits, milk and simple soaps already look mature, with convergence implying flat or even negative volume growth as consumers trade up to healthier oils, premium snacks and more specialised cleaning products.
The fast-growing urban affluent cohort already lives this future, with disposable incomes around $50,000 today and budgets heavily allocated to categories such as education, health, housing, transport, leisure and recreation. On CLSA’s comparative charts, their income and spending mix resembles the middle classes of richer economies such as South Korea or Brazil, and for them the hours-worked affordability curves suggest that most FMCG goods already cost trivial fractions of a working day. The question is no longer whether they can afford a shampoo upgrade but whether a brand can capture their attention and persuade them to adopt a particular format or habit often enough to matter.
The urban emerging and mass cohorts face a more delicate calculation. Their affordability for many everyday categories looks similar to middle-income Asian peers in CLSA’s dataset, but discretionary items such as electronics, vehicles and travel still demand many more working hours than they do for richer cohorts, and for poorer rural segments affordability rarely extends beyond staples. Households graduating into the urban mass and emerging bands will gradually adopt the consumption patterns of middle-income Asia, but only as fast as job creation and wage growth allow, which means mass-market brands that depend on constant uptrading and high-frequency purchases across these cohorts are ultimately hostage to the formal employment cycle.
The next decade of Indian consumption therefore centres on a relatively small but rapidly expanding set of urban consumers reallocating their budgets from basic staples toward non-alcoholic drinks, beauty and personal care, healthcare, appliances, hotels and catering, leisure and recreation. For the urban affluent and wealthy, these categories grow fastest as income rises; urban emerging households move more slowly but in the same direction. Even in 2035, urban emerging and affluent households will still be a minority of India’s roughly 380 million households, but together with the urban wealthy they will dominate the incremental income pool, which is what ultimately determines where profit growth comes from, while the mass and blue-collar cohorts face a slower climb because the formal job engine is not keeping pace with the educational pipeline.
India is simultaneously a poor country and a collection of mid-income economies, the boundary between them shifting in measurable ways. The shorthand of 1 billion people at $2,400 per head is misleading because a small, wealthy cluster pulls the average up, while for 90% of Indians incomes hover closer to $900, held down by the slow pace of formal job creation and modest wage growth in the mass and rural cohorts. For a smaller, rapidly expanding urban cluster, incomes and tastes are converging toward those of rich countries as budgets shift from sustenance to services, comfort and self-expression.
India contains Switzerlands, South Koreas and Brazils nested within a much poorer nation, their locations, age profiles and hours-worked affordability now mapped in far more detail than any headline GDP figure can offer. Arguments about everything from tax policy to infrastructure to urban planning can, in principle, be judged on which cohorts they help and how many people they move from one band to another.
Super post! Would you pls share the link / copy of CLSA report you've referenced?
We lag behind considerably behind China in all economic and social indicators . For example our Nominal per capita income is under $2,000. But China’s is touching just under $ 10,000. We have an advantage of in $ to Local currency ratio. Still we are under $ 7,000 whereas China is $ 22,000. That would mean an average Chinese is three times richer than Average Indian.The percentage of extremely poor Chinese ( those whose per capita income is less than $ 2 per day is under 10%. Whereas Indians (who earn less than $ 2 per day is 30 %. That means over400 million Indians are at extreme poverty level. This poverty level provides less than 1, 700 K. Cal energy but not a balanced Diet. The children born to such parents are mal nourished underweight and do not have proper mental ability and they will be handicapped life long.Hunger and Poverty are the two curses that shall not visit on any body. As we know humans need Proteins build the body and play a major part of Indian dietary deficit. Proteins are obtained from milk, eggs, Dhall (legumes), meat, fish. All these are expensive. Hence we have worlds largest (50%) undernourished children.If you set aside religious issues, rejecting even cow’s meat is harmful. It has an effect of overgrazing the Indian land and degrading grass land. Please remember Without Grass there would be no human civilisation. Please note Ricr, Wheat, Corn, Jowar, Ragi are are grass. I am not advocating any body to eat cow’s meat. But any interference in nature will have disastrous consequences.If you follow the current interventionist policy, Leather Industry will collapse. India loses its competitive edge. Cows themselves will suffer. As once Cattle stops giving milk or bulls become too old to work, they become a burden to the farmer. Then farmer will starve them and they will die in larger number in emancipated condition.However they have made enoromous effort to develop diary industry and broaden their economy.China depends on Pigs and pork as they have very little grazing land. They are well fed as they were not directly colonised as India was and thus they were better fed.In 1947 we were 400 million and hardly producing 40 million tons of food grains. Today we are 1400 million producing close 165 million million tons of major grains and further minor food grains like grains like sweet Corn, maize, Raghi etc..Still our per capita availability of food grain has fallen and availability of legumes, fish, meat has fallen drastically. Only good point we have kept up with populatin increase. Milk availability has increased.China has no such problems. Our democracy, corruption, bureaucracy, poor distribution channels exacerbate the problems.. They have not had such problems as it is ruled by communist regimes. Again I Am not backing totalitarian system as their Great Leap Forward (Cultural revolution ) killed 38 million people.China produces all kinds of Industrial Goods and their GDP is today is larger than USA in PPP, where as we are only a fourth of that. We produce very little manufactured goods compared to China. Comparatively China produces for the world, we almost just manage to produce for our population with a shortfall.We have a trade deficit, whereas China has a trade surplus.Their army is nearly 2 1/2 times larger and spend nearly 4–5 times compared to us. They are challenging US in far flung theatres though cautiously. They are on the way developing a two ocean capability. May be only to safeguard trade routes. We have only started an attempt to safeguard our backyard of Indian Ocean.We have better Air Force and Navy but entirely dependent upon foreign supplies, but they have built indigenous defence Industry. We lag behind them in capacity. It will suck our resources badly.They have serious threats all around them and they have no genuine friends. Japan, ASEAN, US, Russia India and Europe are all weary of them their friends are Pakistan and North Korea. They can purchase friends with money and aid. We have only weary neighbours. But only Pakistan as serious enemy. Even China is only a weary neighbour.They have lots insurgency in their periphery like Xinjiang, Tibet, Inner Mongolia, party troubles etc. We are also in a similar situation including Kashmir.