

Paying 230 Times Earnings
India trades like nowhere else.

Lenskart is asking investors to value the Indian eyewear retailer at $7.9 billion, or over 230 times its earnings. The multiple has drawn criticism from retail investors. The disapproval focuses on one company, but the valuation sits within a market where extreme multiples have become commonplace.
At 230 times earnings, investors are paying the equivalent of more than two centuries of today’s profits before accounting for any discount rate.
Under a 20-year scenario, and that’s saying something, Lenskart would need to grow earnings by 26% annually for the first decade and 18% for the second decade, producing roughly a 50-fold increase in profits. Most investors price in growth over 5-10 years at most. Even during periods of peak market enthusiasm, multiples above 100x are rare and typically signal speculative excess.
Investors buying Lenskart at this valuation are paying today for what the company might become two decades from now.
Lenskart reported profit after tax of $33.5 million for the fiscal year ended March 2025. This figure includes a one-time non-cash gain of $18.8 million from an acquisition liability adjustment. The operational profit stands at approximately $14.6 million on revenue of $750 million, producing a margin of 1.95%. The company turned profitable in FY25 after losses in the prior two years.
Under a (still very generous) scenario where profits grow 50-fold over 20 years, Lenskart would need to grow operational profit from $14.6 million to $730 million. Even under that heroic scenario, it would require revenue of $37.4 billion.
The Indian eyewear market stood at $8.88 billion in FY25, according to consulting firm Redseer, which was commissioned by Lenskart to prepare a market study for the IPO prospectus. Redseer projects the market will grow at 13% annually to reach $102 billion in 20 years. Lenskart currently holds between 4% and 6% of the market and would need to capture roughly 37% of the projected market to hit the required revenue target.
Titan, which also sells eyewear in India, said this week it pegs the Indian eyewear market at roughly $3.4 billion today, growing between 7% and 8% annually. The company expects the market to reach about $5 billion by 2030.
A $3.4 billion market growing at 7.5% annually would reach approximately $14.5 billion in 20 years. Lenskart needs $37.4 billion in revenue to justify its valuation at current margins.
Under Titan’s market size estimates, Lenskart would need to capture more than 250% of the total market. Under Redseer’s projections, Lenskart would need to command 37% of the Indian eyewear market two decades from now.
But Lenskart isn’t the real issue. Its valuation sits at the extreme end of a market where elevated multiples have become standard.
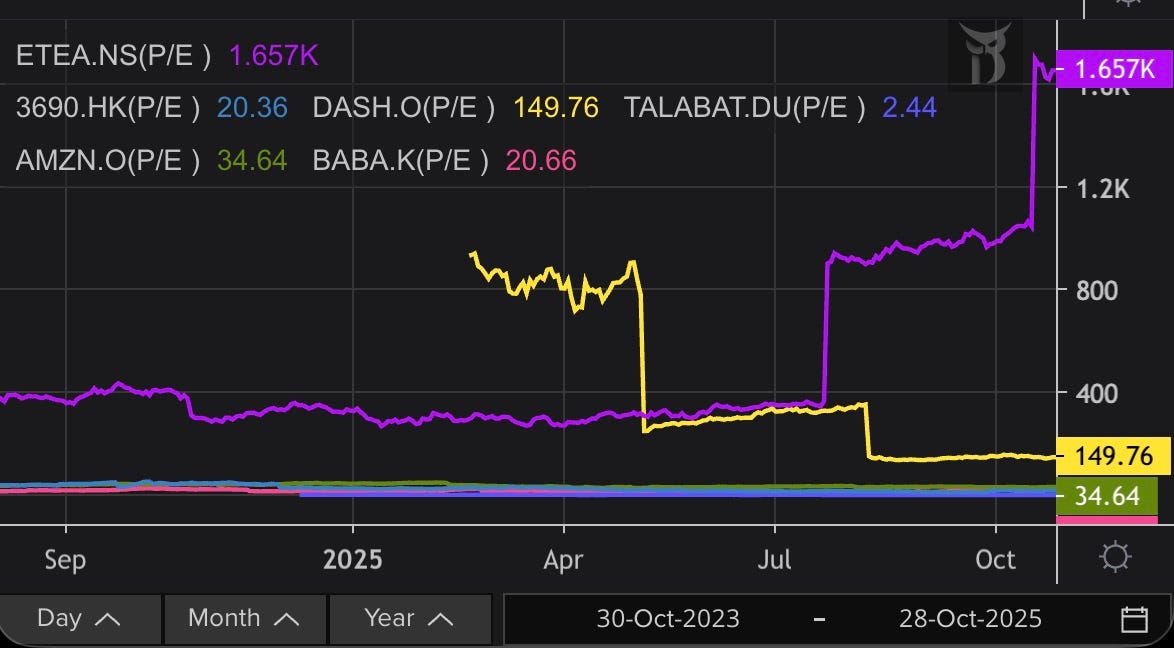
Lenskart will not be alone on the Indian stock exchanges if it commands that multiple. There are 58 companies listed on the National Stock Exchange of India with price-to-earnings ratios over 230, according to an analysis by India Dispatch. More than 180 companies trade at multiples higher than 100, compared to about 80 on the New York Stock Exchange.
Indian stocks aren’t cheap by any measure. Right now, they trade at 25.5 times their earnings. To put that in context, when you look at decades of data on Indian stock valuations, the current multiple is higher than 87% of all historical readings. The historical average is 19.5 times.
Against other developing economies, India trades at a significant premium. The MSCI Emerging Markets index — a collection of stocks from countries like China, Brazil, South Korea, and Taiwan — trades at much lower multiples. India’s stocks are priced roughly 50% to 60% higher than this broader emerging market basket, compared with a typical premium of about 30%.
India also trades rich compared with its own history. The price-to-book ratio, which measures what investors pay relative to a company’s net assets, stands at 3.6 times versus a historical average of 3.1 times.
But here’s the thing. India’s growing weight in global indexes suggests investors are willing to pay up. Indian stocks now represent over 2% of the MSCI All Country World Index, a benchmark tracking stocks across developed and developing nations. Two decades ago, India’s weight was less than 0.5%.
In private conversations, investors and analysts argue that the premium makes sense. India has achieved something rare in emerging markets: high growth combined with falling volatility in both inflation and economic expansion. The government has consolidated its finances while the economy has reduced its dependence on imported oil. Perhaps most significant, Indian households are moving bank deposits and savings from property into stocks, a structural shift that creates sustained demand even at elevated prices.
India also offers high long-term growth potential due to low household penetration of discretionary products. When per-capita income grows, most categories from automobiles to healthcare to insurance to consumer durables could see sustained growth for many years. High long-term growth in discounted cash flow models translates to high price-to-earnings multiples.
Return ratios in India exceed those of most other major markets across sectors like automobiles, consumer staples, insurance, hospitals and banks. For automobiles, reinvestment rates and working capital requirements are lower in India. For consumer companies, return on equity is higher due to pricing power and distribution strength.
Domestic demand for financial assets exceeds supply. Less than 8% of financial investments of an Indian household are in the stock markets. In the U.S., this figure has risen to 35% at peak periods. The limited participation means more money continues to flow into equities as household wealth grows. Even China A shares command higher valuations than H shares due to higher domestic ownership. The impact becomes more pronounced when considering the low free float of Indian stocks. Average free float in India stands at only 44% compared to 67% for peers.
The final factor relates to perceived risk. Valuations factor in the earnings potential of an asset and its cost of equity. Cost of equity depends in part on the sovereign rating of a country. For India, HSBC believes the perceived risk is lower than sovereign ratings suggest. India has rarely been impacted by a sharp macro crisis, unlike many other large economies. The regulatory regime in India has been proactive in preventing economic bubbles, excluding small cycles like ILFS in 2018 and unsecured lending issues in 2008-10.
India’s structural advantages are real, and they support a market premium. But a market trading at justified premiums can still host individual valuations that make no sense. Maybe India deserves to trade richer than other emerging markets. It can also be true that a 230x multiple on a company requiring 250% of a market is detached from any reasonable outcome.
Thanks for putting this together - it seems that there is a need to relieve some of the demand pressure from the market. Should institutional/ retail investors be given a freer hand to allocate to global opportunities than they are allowed currently?
. If the Chinese government can keep the job market fairly stable, navigate the perils of growth, and avoid wars, ….never.
One good thing about the Chinese government is that it is always focused on the economy and plans years in advance. China can look 20, 30 years into the future and keep it’s growth aimed in a steady and unrelenting manner. China is a model for other underdeveloped countries to follow. Her diverse growth and economic stature is nothing short of amazing over the last 30 or so years.
This is one thing that western countries cannot do efficiently and effectively. Changes in parties, changes in government, compromises, budgetary constraints, and short range planning cause inefficient and sometimes paralyzing decisions. An uninformed and uneducated citizenry cannot optimize Democracy in today’s fast moving world. A biased, misleading, and false media and leadership makes a mockery of what Democracy was meant to be. In this environment, swings tend to be more pronounced and dramatic so false bubbles form and pop. Greed of a few overwhelm the desires and needs of the masses. Oligharchs are dominating many countries today, including the United States.
One thing China needs to watch out is her demographics. Like Japan, China’s senior population is growing and because of it’s ‘one child’ policy, a contraction in population with a aging of it’s working population will occur. Japan suffers from this malaise today and no end is in sight. Some predict her population will decline by a third by 2060. (Wikipedia) The decline in population in Japan is not because it had a ‘one child’ policy but because couples decided against having children or young people staying single, the effect is the same, population decline.
Japan’s technology lead is waning, her population is declining, and wealth creation is stagnant. Abe is trying to revive the military as one way to keep the economy alive. (the Korean War catalyzed Japan’s economic miracle after world war 2) North Korea’s threat has come at the right time for Japan to use this as the excuse to grow the military and to sell weapons overseas as a new growth market. Time will tell if this works.
Japan probably is in more peril than China because Japan tends not to allow new immigrants or foreigners to become Japanese citizens or residents. China too can suffer this effect if it does not plan ahead. With that in mind, automation is the future of manufacturing and many logistic processes. Japan and China are strong in this area and it will help offset the young people labor shortage in the near future. The future problem will be the support of seniors and the healthcare system as they live longer.
China’s Communist Party currently promotes innovation, disruptive technologies, and new ideas which, if the seeds sprout, will ensure future products and markets. Currently, things like infrastructure, fast trains, electric transportation, food production, super computers, QR code applications, high density batteries and capacitors, solar, and wind help to ensure current and future markets. Artificial Intelligence, nuclear (Thorium and Fusion, high temperature reactors), biologics, synthetic biology, genetics, nanotech, quantum applications, aerospace, marine mining, space applications, and more will continue to propel China in the future. Technology has been, is, and will be the wave that carries economic growth and prosperity forward for China.
As long as China’s government continues to support these efforts and shares these financial benefits with her citizens and expands to share these technologies with her neighbors and friends, the world will become more China centric and the future will look bright. China’s vision of a ‘peaceful rise’ should be the vision for all countries.
China’s support of Africa, and now Eurasia (Belt Road Initiative), will grow the seeds of future growth in food, energy, and resources. Integrated economies will help lessen the threat of wars and discord. Shared logistics and development is a win-win for all countries involved.
America used to be that beacon and technology was her strength. Today, her government, politics, and wealth distribution is destroying the advantages she had to become the hegemon of the world. Her political leadership is void of moral, technical, and political wisdom. Today, America is in decline and her leadership is incompetent and lacks the wisdom to support future technologies and their ecosystems.
China’s only fear should be that she too will become ambivalent and become like America or like her history past during the century of humiliation. Let’s hope her leaders remembered that lesson well and China will continue to be a great and strong nation,